NORMAL WEATHER
I have a system for predicting the weather. I watch the weather forecast on TV and predict the exact opposite. I am right about 50% of the time. You may think I’m joking, but it really works. Try it for yourself, and you’ll see that coming up with a valid weather forecast is not easy even for professionals. It won’t be exactly 50%, but it will be close enough to make the point that there are so many factors that influence the weather that it is nearly impossible to predict rain or shine for tomorrow or next week and consistently get it right.

A friend of mine recently wrote on Facebook, “You don’t know what the weather is going to do anymore. It is no longer normal”. If the weather is no longer normal, please tell me what is normal. How do you identify it? And when was the last time the weather was normal?
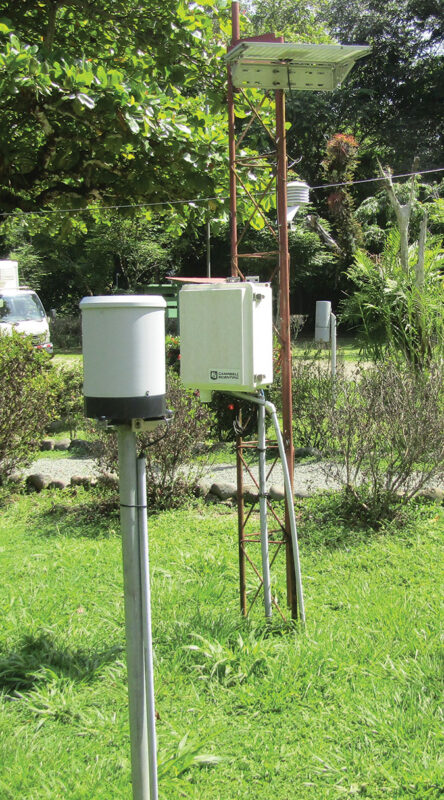
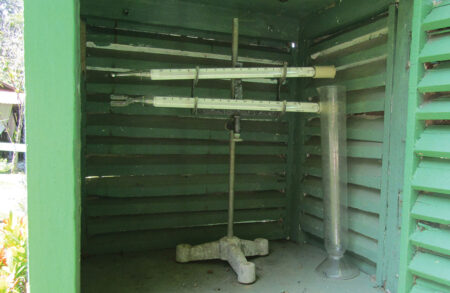
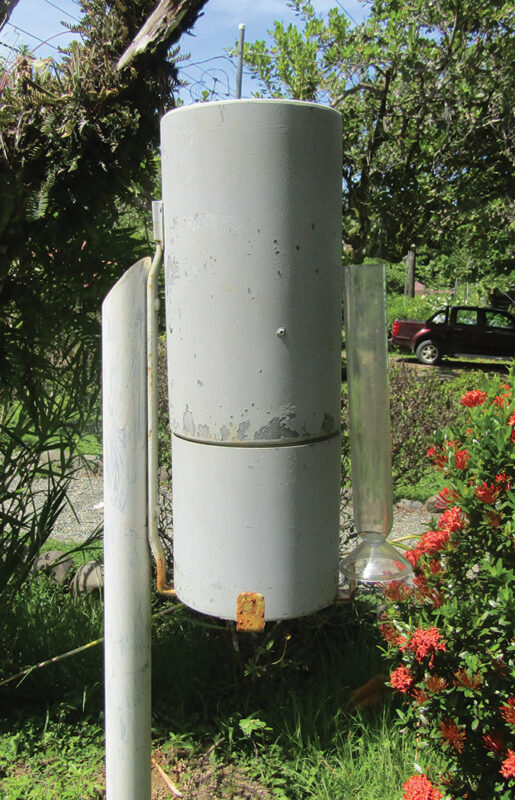
In the year 1981, I decided that it would be nice to have a record of the precipitation at Hacienda Barú, so I started measuring the daily rainfall and writing it down in my agenda. My first rain gauge was a tin can setting on top of a post, and a six-inch plastic ruler. Every morning at 07:00 am I would measure the water in the can, write it down in my agenda, and empty the can. After ten years the Costa Rica weather bureau heard about my rain gauge and came to see me. They asked if I would give them a copy of my precipitation record and if I would be willing to manage a more sophisticated system of measuring and recording the rainfall and the high and low temperatures. I agreed to both, and they brought a very nice rain gauge and two thermometers, one to measure the highest temperature of the last 24 hours and the other to measure the lowest temperature. About 15 years later they brought us an electronic weather station that sends all that information and more to the Costa Rica weather bureau daily via the internet.

The rainfall has varied considerably during the last 42 years, from 1981 through 2022. For example, the year with the highest level of precipitation was 2010 with 7489 mm, (About as high as me standing on the peak of the roof of a two-story house.) I think that the year 1988 may have had a higher precipitation than 2010, but my rain gauge, the tin can, overflowed six times during the six days of torrential rains brought by Hurricane Joan, and I have no way of estimating the amount of water that was lost and not recorded. The year with the lowest precipitation was 1997, with only 2622 mm (a little lower than an NBA basketball hoop). There were 11 years when it rained more than five meters (5000 mm) and 15 years when it rained less than four meters (4000 mm). The average annual precipitation for the last 42 years was 4310 mm. 1987 had a precipitation of 4325 mm, very close to average, but it was very dry the first five months of the year and very wet the last seven. I would be hard-pressed to determine a “normal” year out of those last 42 since we started measuring and recording the rainfall.

I have heard people say that the weather used to be normal, but now we have more extreme weather events. Yet the worst hurricane to affect Costa Rica in recorded history was Janet who reaped her havoc in 1955, slowly making her way north, close to the Caribbean coast of Costa Rica as a category #4 hurricane. By the time she reached Mexico, she was a category #5. Janet was the first hurricane to kill over 1000 people, most of them in Mexico. I doubt if there is any record of how many died in Costa Rica and the rest of Central America. And there is surely no record of how much water she dumped on us. Dominical was completely underwater for six days. There was a two-story hotel in Dominical at that time, and every person in town crowded onto the second story where they were marooned for six days. The severe flooding destroyed all the banana plantations on the Pacific coast in the area around Quepos and Parrita. The banana company never replanted bananas and eventually ended up planting oil palms.
But let’s go back even further. Have you ever heard of the 400-year-long Medieval Warm Period (900 AD to 1300 AD) when the average temperature reached a level higher than it is today? The Arctic ice cap melted to a point that enabled the bowhead whales to migrate from the Bearing Sea across the Arctic to Greenland and the Atlantic. Some of the Inuit people followed in their seal skin boats which they used to hunt the whales. They settled in Greenland and their descendants still live there today.
A large group of Norwegians settled, farmed, and raised livestock in southern Greenland and lived there until the Medieval Warm Period came to an end around 1300 AD and the Little Ice Age began. The average global temperature soon cooled to the point that farming there was no longer possible. Unfortunately, the Norwegians didn’t learn anything from the Inuit People about living under artic conditions and the last of them starved or froze to death. After 600 years of cold weather, the climate changed again, and another warming period began in the early 1900s.
Like all of nature, our climate is in a constant state of change; it always has been and always will be. There is no such thing as normal weather. It is simply a term people use that means that the weather is not the same as they remember it to have been at some undetermined time in the past, perhaps their childhood.

CLICK TO ENLARGE
Jack Ewing was born and educated in Colorado. In 1970 he and his wife Diane moved to the jungles of Costa Rica where they raised two children, Natalie and Chris. A newfound fascination with the rainforest was responsible for his transformation from cattle rancher into environmentalist and naturalist. His many years of living in the rainforest have rendered a multitude of personal experiences, many of which are recounted in his published collection of essays, Monkeys are Made of Chocolate. His latest book is, Where Jaguars & Tapirs Once Roamed: Ever-evolving Costa Rica.

